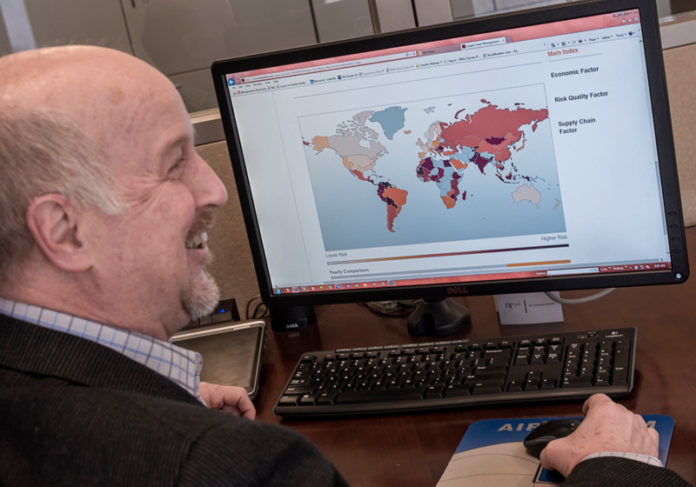
Most FM Global clients operate companies on a multinational scale. Their executives need information on vulnerabilities, and underlying economic issues that could disrupt productivity in often far-flung locations.
FM Global, a Johnston-based mutual insurance company, identified this need and partnered with Oxford Metrica LTD, an English company that specializes in analytics. Together they created the FM Global Resilience Index, designed to use both proprietary and independent data to rank the supply-chain resilience of 130 countries.
The interactive, online tool allows managers to evaluate countries against nine factors in three categories: economics, risk quality and supply-chain factors. A composite index ranks the countries in order of resilience, and company executives can also decide to evaluate countries based on individual categories.
Business Insurance magazine in its March 2 edition recognized FM Global with a 2015 Innovation Award for the resilience index, which is available online for the public as well as FM Global clients.
The resilience index was designed over a two-year span and launched in 2014, according to Randy Schreitmueller, vice president and manager of broker relations for FM Global.
After its launch, the index was backloaded with more data from prior years, to help executives identify trends and patterns.
Companies need such information to determine which suppliers to select, where to locate facilities or approve mergers, and to evaluate the supply-chain resilience of countries where customers’ facilities are located, according to FM Global.
The inspiration was clients who increasingly are operating in or relying on suppliers in multiple international locations. Until the index, the information was available from recognized sources – such as the International Monetary Fund, which collects economic data – but risk-management executives would have had to distill the various factors themselves in evaluating countries, according to FM Global. Using the resilience index, the information now is available to them as an online tool.
The information will be updated yearly, with the possibility of periodic additions as well.
The index can be used in several ways. The composite index lists the countries in order of resilience, based on nine “drivers,” or risk factors, which have equal weight.
They include: gross domestic product, political risk, oil dependence, exposure to natural hazards such as earthquakes or hurricanes, quality of the natural hazard risk management in a country, control of corruption and infrastructure.
Based on all nine factors, Norway, Switzerland and the Netherlands emerged as the top three countries in the newly released 2015 index. Norway was assisted by its North Sea energy supply, which makes it highly resistant to disruption in energy prices.
Ukraine and Thailand, by contrast, had the most significant falls in 2015. Ukraine’s fall, to 107th place, directly relates to neighboring Russia’s military intervention in the country, and a weakened infrastructure. Thailand’s decline on the index was attributed by FM Global to poorer perceptions of the country’s infrastructure, the quality of local suppliers and a decline in political stability.
The bottom-ranked country in the index is Venezuela.
The United States is divided into three regions for the purpose of the resilience index, which factors in the different geographies of the country, and the varying exposure to natural hazards. The East Coast and Gulf Coast are one region, the broader Midwest and Southwest a second, and the Pacific Coast and Pacific Northwest form another. Of these, the section that encompasses the Midwest and the Southwest scored the highest, placing 10th on the composite index.
Since the index became available, the feedback has been overwhelmingly positive, according to Schreitmueller.
With the exception of the risk-quality data, which is derived from FM Global, all of the information comes from independent sources. The GDP data comes from the International Monetary Fund. Oil data is obtained from the U.S. Energy Information Administration. Political risk and control of corruption data are from the World Bank’s “Worldwide Governance Indicators.”
After the index was published online, website analytics showed that it was being heavily used.
“I think people were surprised at how much of a following this thing got,” Schreitmueller said.
The index represents the countries where FM Global conducts site assessments for its risk-quality data, according to Schreitmueller.
While 75 percent of the FM Global clients operate in more than one country, many operate in several dozen locations. One client, he said, has production facilities in 56 countries. •


