Reporting on jobs figures is never an easy task. It is one of the reasons that the regular reports on jobs focus on the simple unemployment figure, known to aficionados as the U-3 figure, which is derived by dividing the total number of unemployed people by the civilian labor force.
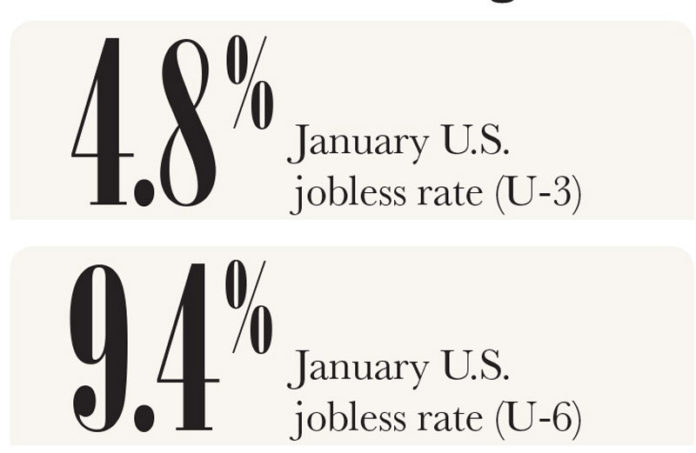
For January, that calculation yielded a national unemployment rate (seasonally adjusted) of 4.8 percent. Twelve months earlier it had been 4.9 percent. Rhode Island’s most recent calculation was for December, when the state claimed an unemployment rate of 5 percent, a drop from 5.4 percent at the end of 2015.
Many people believe that another measure of labor utilization, U-6, captures a more accurate picture of the American labor market. This figure is arrived at by dividing the total number of unemployed people plus all those who would like to work but have not looked recently and those available for full-time work who could only find part-time employment, by the total of the civilian labor force and all people who are neither working nor looking for work who say they want to work. That figure was 9.4 percent in January, a drop from 9.9 percent a year earlier. That level of detail is not provided by the R.I. Department of Labor and Training.
Recently these figures, along with many others produced by the professional staffs at the U.S. Bureau of Economic Analysis and the U.S. Bureau of Labor Statistics, have been called into question by the new administration. In fact, President Donald Trump has challenged specifically the jobless numbers. The president went so far as to say that the reported jobless data in early 2016 were “phony numbers,” according to Bloomberg News. “The number is probably 28, 29, as high as 35 [percent]. In fact, I even heard recently 42 percent.”
Later in the same story, Bloomberg reported that in 2015 candidate Trump said the United States had 93 million people out of work. While that number does seem quite a bit higher than the official number in January 2016 of 7.8 million unemployed Americans, there is a numerical basis for his claim.
At the beginning of 2016, the United States had a “civilian noninstitutional population” (the official BLS term) of 252.4 million. But the civilian labor force was listed as 158.4 million. Hence the official unemployment rate at that point of 4.9 percent.
But if you put back the 94 million people not in the labor force, that is, not actively looking for work, the jobless rate could be said to have been 40.4 percent. Just how accurate that calculation is, however, is a matter for serious debate. The people counted as not in the labor force could be in school, caring for children or other family members, or just retired. It doesn’t seem realistic to include those people in the labor force. And it could make policy solutions based on those assumptions ill-conceived. •


